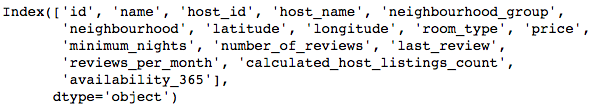
Data Wrangling
Importing Data Select, Drop & Rename Filter, Sort & Sample Add Columns Cleaning Data Dates & Time Join Data Aggregate & Transform
Data Analysis
Exploring Data Plotting Continuous Variables Plotting Discrete Variables
Machine Learning
Data Preparation Linear Models
Other Tutorials & Content
Learn Python for Data Science Learn Alteryx Blog


Exploring Data in DataFrames with Python Pandas

Get DataFrame Columns Names

data.columns

Get DataFrame Column Metadata

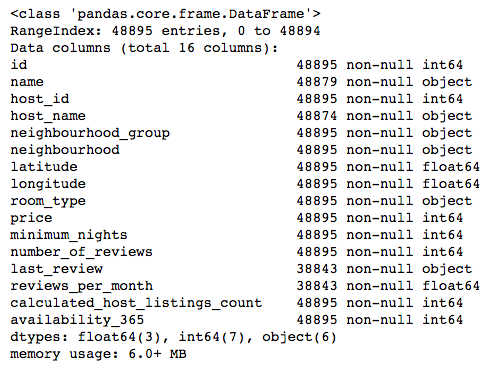
Find the data types and non-null rows for each column in a DataFrame:

data.info()

Get Descriptive Statistics for Numerical Columns

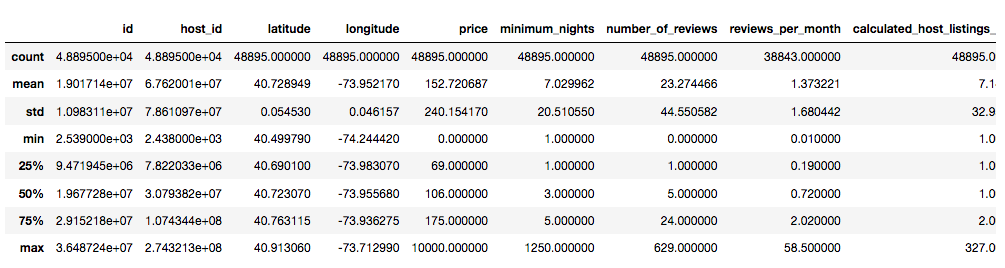
View descriptive statisctics including mean, standard deviation and minimum and maximum values for each numerical column in the DataFrame:

data.describe()

Visualise DataFrame Null Values Using a Heatmap

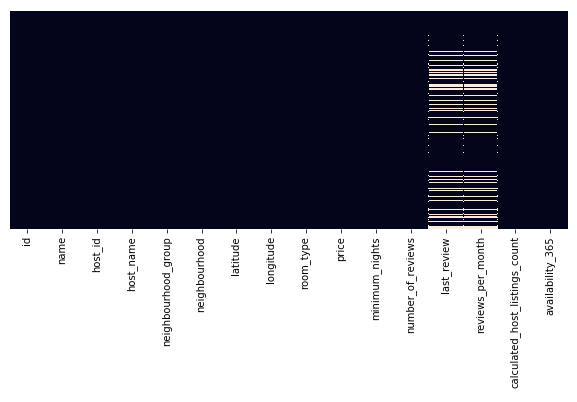
Display a heatmap showing where light blocks indicate null values in the DataFrame and which columns they belong to on a 10 x 4 plot. Requires Seaborn and Matplotlib to be imported.

plt.figure(figsize=(10,4))
sns.heatmap(data.isnull(),yticklabels=False,cbar=False)

Correlation Heatmap

Display a labelled heatmap showing the correlation values between the numerical columns in the Data DataFrame on a 10 x 8 plot. Requires Seaborn and Matplotlib to be imported.

plt.figure(figsize=(10,8))
sns.heatmap(data.corr(),annot=True)

Correlation for a Particular Column

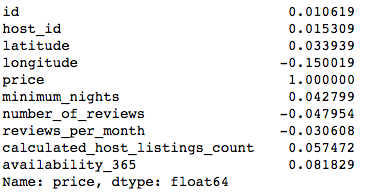
Display the correlation value between the numerical columns in the DataFrame and the 'price' column:

data.corr()['price']

Sorted Correlation for a Particular Column

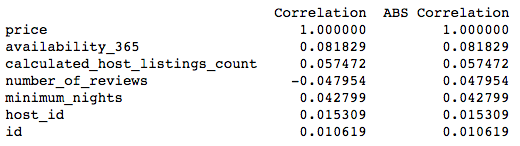
Display the correlation and absolute column values between the numerical columns in the DataFrame and the 'price' column in order to show the most correlated or inversely correlated columns:

def correlation_table(data,target_column):
data_num = data.select_dtypes(include=['int'])
corr_df = pd.DataFrame(data_num.corrwith(data_num[target_column]),columns=['Correlation']).dropna()
corr_df['ABS Correlation'] = abs(corr_df['Correlation'])
corr_df.sort_values(by=['ABS Correlation'], ascending=False, inplace=True)
print(corr_df)

correlation_table(data, 'price')