.png)
In this part we’ll be importing data from several csv and Excel files into Pandas dataframes. We’ll also inspect the data stored in the dataframes, looking at the shape of the data, the data types, column names and if there are any missing values.
Before we import any data we need to import the Pandas library where the convention is to import as pd.
We are going to import 4 csv and 1 Excel file that we will process and blend together. The files are products.csv, orders.csv, returns.xlsx, promotions.csv and customer.csv. They can be downloaded here if you want to code along.
Let’s start by importing the products csv file. In order to do this we use Pandas read_csv function and pass the path to the file (which in our case is stored in the data folder) as a parameter. We store any Pandas data structures inside variables as we can with any other Python object.
(Note: the path extends either the location of the script or the working directory depending on how you’ve setup your environment. You can always use the full path if needed)
Pandas let’s us pass several parameters into the read_csv function that change how Pandas imports the csv file. We do this by specifying the parameter in-between the brackets as we would for any regular Python function. We have already passed one parameter telling Pandas where the file we want to import is located. Other useful parameters include the following:
The full details on all parameters that can be used with the read_csv function can be found in the Pandas documentation here.
We are now going to import the orders csv file. If you open the file in a spreadsheet or text editor you will notice that there is a column called Order_Date that contains, as you’d expect the date of the order. Given that we know that this field is a date, let’s use the parse_dates parameter when importing the csv to immediately convert the column to a datetime data type.
The files we’ve imported so far have been csv files but the returns file is in Excel format. We can import this in a similar way by using the read_excel function in Pandas. We import in the data in the same way, by passing the path of the file as a parameter in the function but we can also pass in an additional parameter to tell Pandas which sheet in the excel file our data is stored in. If we don’t pass a value for the sheet parameter then Pandas will just assume we want to import the data in the first sheet it finds.
Let’s import the returns.xlsx file using the read_excel function. The data we require is stored in the “Returns” sheet so we’ll declare this with the sheet_name parameter.
We can also pass in many of the same parameters described above for the read_csv function. The full list can be found in the Pandas documentation here.
Now we’ve imported some data, let’s explore the products dataframe in more detail.
First let’s look at the shape of the data, that is how many columns and rows of data do we have. For this we call the shape function on the products dataframe.

The output of this tells us that we have 50 rows of data and 6 columns.
Let’s actually looks at some example rows of data by calling the head function.
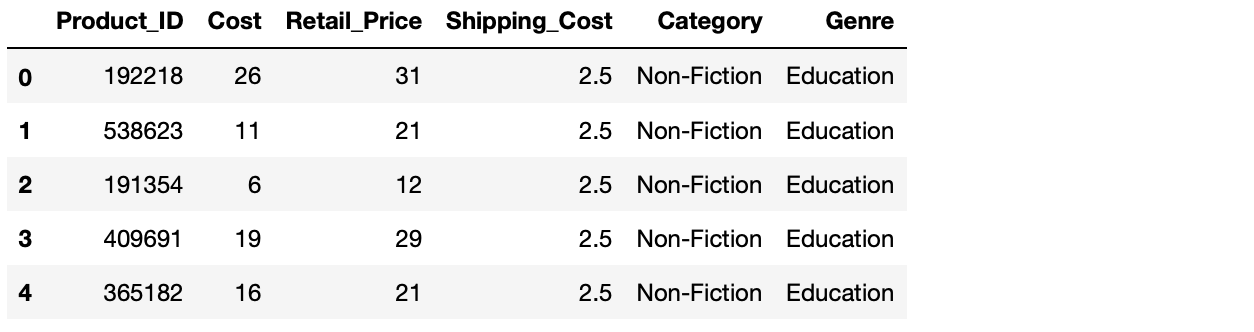
By default, calling head will show us the first 5 rows of the dataframe but you can place any number greater than zero inbetween the brackets to return more examples.
So we know the shape of the dataframe and have seen some examples of what is in there so let’’s not get some more information about the dataframe by using the info function to get some metadata.
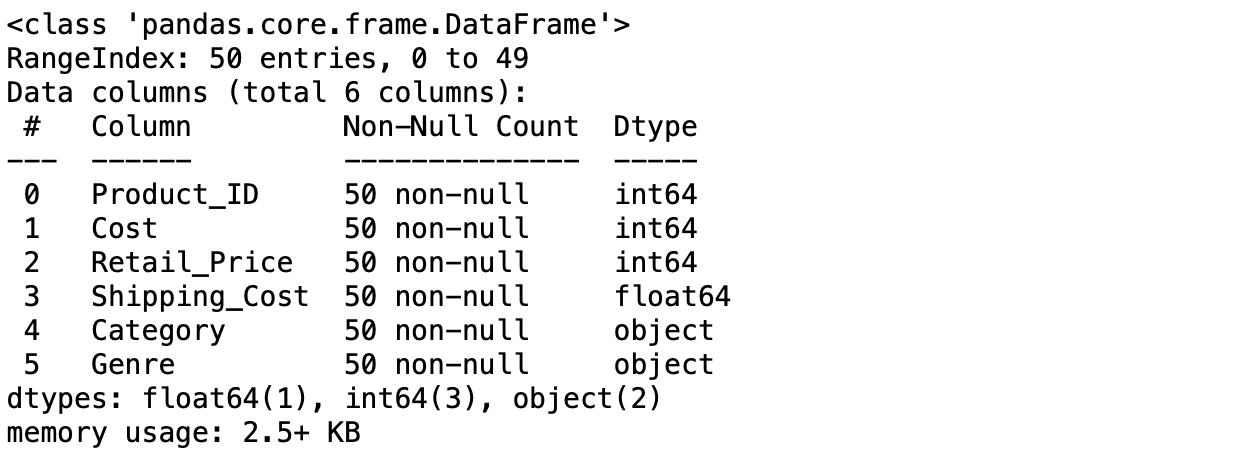
Here we can see the name, how many rows contain non-null values and the data type for each column. We can see from this that all rows in all columns contain values so we have no missing data. We can also see that we have four numerical columns and two listed with object data types. While this may seem ambiguous, object data types often just means it’s a column that contains string as technically these are objects.
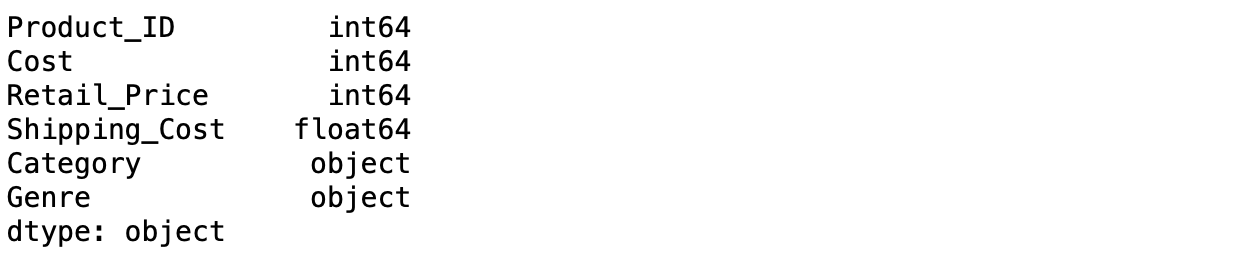
If we wanted to just find the column names or date types of a dataframe we can simply use the columns function or dtypes function rather than calling the info function.

Import the promotions and customer csv files using the read_csv function. Once you’ve imported them try exploring the dataframes to get a feel for the data that’s in there.