.png)

In this tutorial we will see how to implement the Catboost machine learning algorithm in Python. We will give a brief overview of what Catboost is and what it can be used for before walking step by step through training a simple model including how to tune parameters and analyse the model.
Catboost is a boosted decision tree machine learning algorithm developed by Yandex. It works in the same way as other gradient boosted algorithms such as XGBoost but provides support out of the box for categorical variables, has a higher level of accuracy without tuning parameters and also offers GPU support to speed up training.
Catboost is used for a range of regression and classification tasks and has been shown to be a top performer on various Kaggle competitions that involve tabular data. Below are a couple of examples of where Catboost has been successfully implemented:
For this short tutorial we are going to use the classic Titanic dataset to predict whether a passenger on the ship survived or not. The intention here is to keep this tutorial simple using a small dataset but the principles will apply to more complex datasets and problems you might be trying to solve.
Before we start, let’s import the libraries we will need and also the titanic dataset.
Initially we’re simply going to drop any rows that contain NaN for the “survived” column which is our target as this doesn’t help our model.
Now for this tutorial we are only going to make use of 4 features; pclass, sex, age and fare. Let’s split our data into X and y to get our feature and target dataframes.
Now we still need to treat some of the features. We need to convert the “pclass” column to a string data type as although it appears numeric, the values are discrete so it’s actually a categorical variable in this context. In addition, the “fare” and “age” columns contain some NaNs so we’ll replace these with zeros.
As mentioned above, Catboost provides support for categorical features with no need to one-hot encode or dummy any columns. To enable this we need to do two things.
First we need to generate a list of column indices that contain the categorical data. This list will be passed to the model during training. Now, we only have two categorical variables so it’s easy for us to identify the column indices manually (in our case it’s the first two columns; “pclass” and “sex”) but in another project you could be working with any number of categorical columns. Given this, let’s create a function that takes a dataframe and returns indices of all non-numeric columns as a list.
Now we can reuse this function to get the indices of non-numerical columns for any dataframe when we use Catboost.
The second thing we need to do is convert all categorical columns to the category data type which is required by Catboost. To do this we are going to use another function and similar logic to the previous step to identify non-numerical columns and convert them to the category data type.
Finally, before we begin training our model we need to split our data into two datasets for training and testing.
Now there is an additional complication; if we print out the survival rate of of our test set we can see that our training data is imbalanced.
There are a few ways to handle this but in our example we are simply going to undersample the training data.
To train our model we are going to wrap our train and test datasets in a Catboost pool constructor. We can define our features, target and list of categorical features inside the pool constructor and then pass these as one when training and evaluating our model.
Now let’s initiate the Catboost Classifier.
As this is a binary classification problem we’ll use log loss as the loss function and evaluate based on accuracy.
Note: If you are looking for an intuitive explanation of log loss then check out this article from Daniel Godoy.
To train the model we are going to use Catboost’s inbuilt grid search method. If you have used Sci-Kit learns Grid Search CV then this works in the same way. First we declare a dictionary of the hyperparameters that we want to tune and lists of values to test. We have decided to tune just a few of the most influential parameters: learning rate, tree depth, L2 leaf regularisation and also the number of iterations we will train the model for.
Now we can fit the model using the grid search method by passing the grid dictionary we declared above along with the training data pool. By default grid search splits the training data into an 80/20 split for training and testing with a three fold cross validation strategy.
The model has now been trained and you can print out the optimum parameters that have been found using grid search if you’re interested.
Now that we have trained our model we can evaluate how it performs on our test data and then briefly see what features are most influential.
To start with we’ll use our model to make predictions for our test and the print out a classification report.
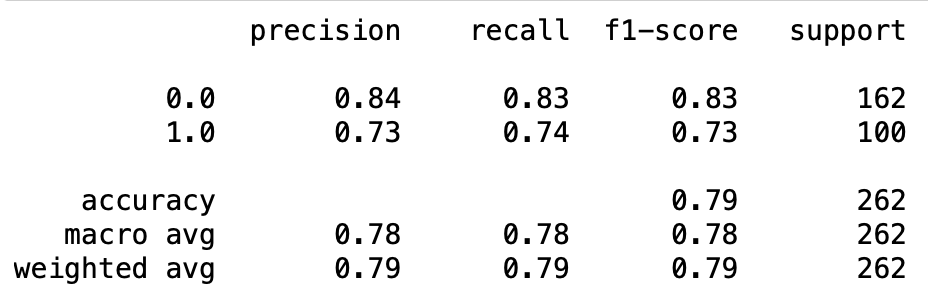
As we can see we got an accuracy of 79% on our test set which isn’t bad considering we are only using four features.
To delve further under the hood of our model we can analyse what impact our features have had by plotting the feature importance.
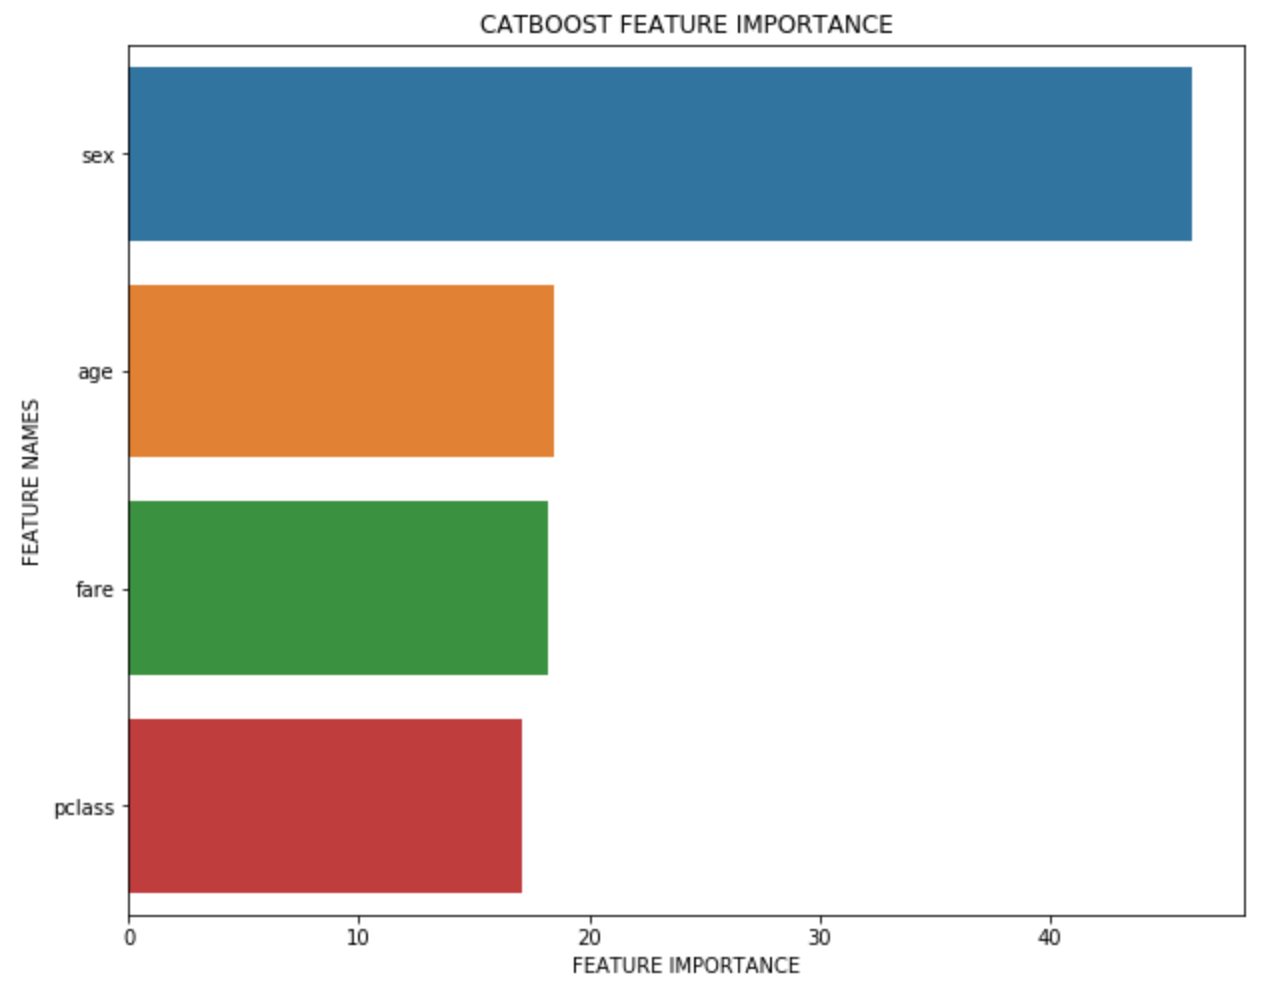
As you can see the “sex” feature was by far the most dominant feature.
If you want a more detailed breakdown of the feature importance function then you can read about it here.
Finally, we can analyse how our model performed on our test data by breaking the performance down by feature values. Catboost comes with function called calc_feature_statistics which plots the average real value and average value of our models prediction for each feature value. Let’s generate a feature statistic plot for the “sex” feature in our test data.
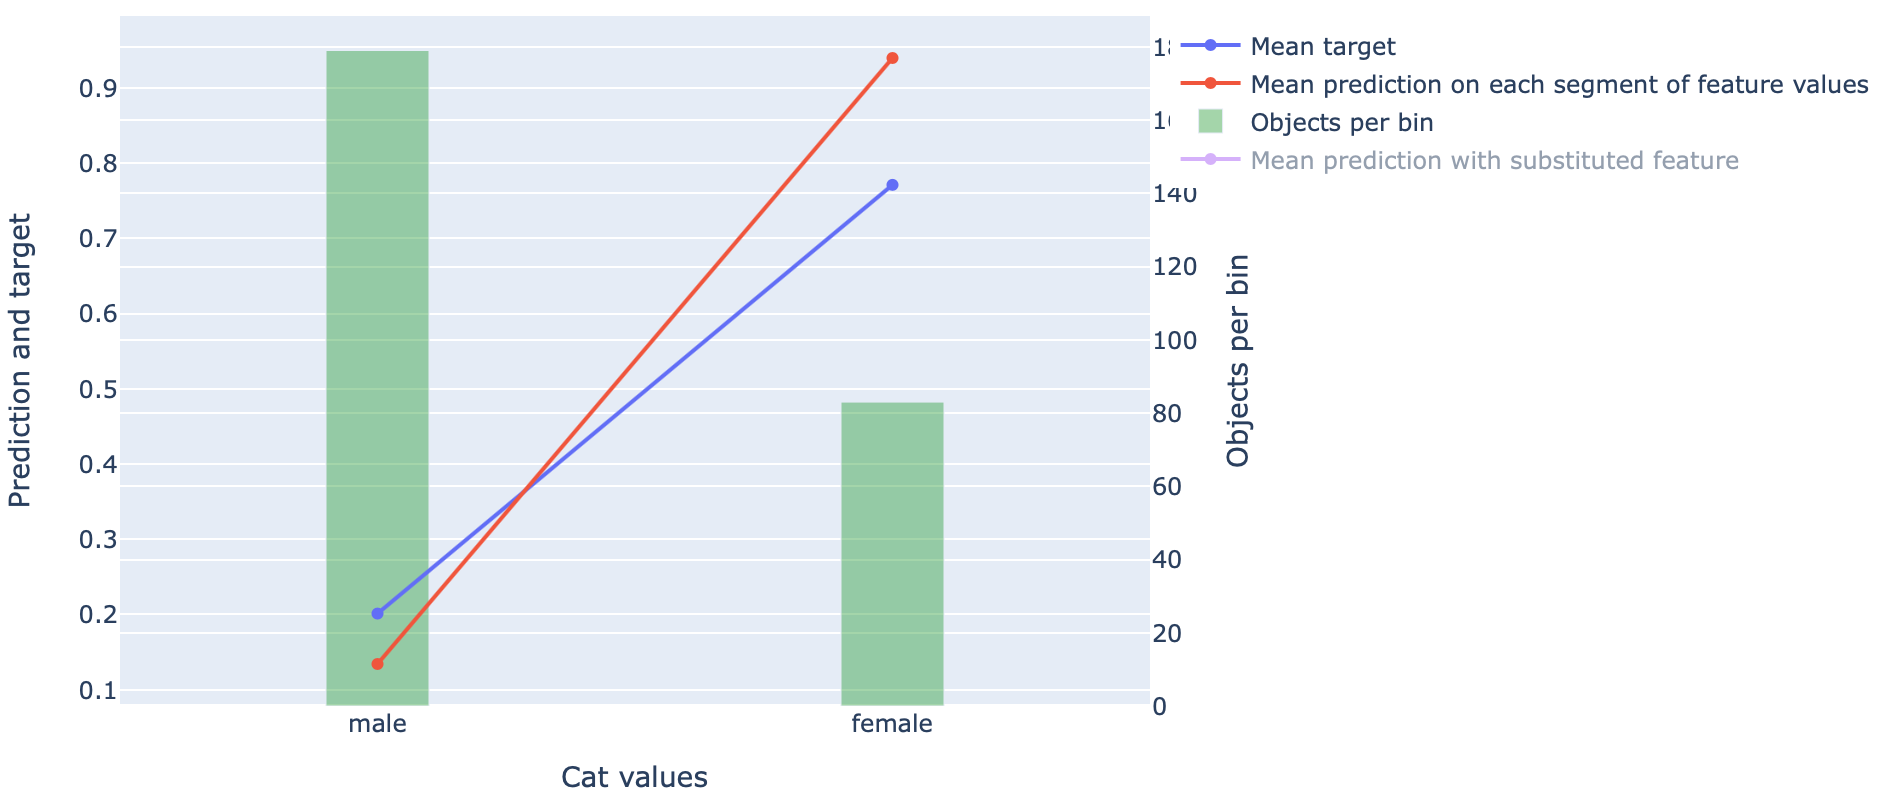
This tells us that we had a lot more examples of male passengers in our test dataset but that females were more likely to survive. The plot also indicates that our model was biased towards females surviving compared to men than was actually the case in our test data.
So there we have it, a quick walk through of how to implement Catboost using Python. Catboost contains many additional options to customise your training and evaluate your model. For further detail, check out the Catboost documentation here.